I like the JVM a lot because there are a lot of tools available for inspecting a running JVM
instance at runtime. The Java Mission Control (jmc) is one of my favorite tools, when it comes
to monitor threads, hot methods and memory allocation.
However these tools are of limited use, when monitoring an event-driven, message-based system
like Akka. A thread is almost meaningless as it could have processed any kind of message. Luckly
there are some tools out there to fill this gap. Even though the Akka docs are really extensive and
useful, there isn’t a lot about monitoring.
I’m more a Dev than a Ops guy, so I will only give a brief and „I thinks it does this“ introduction to
the monitoring-storage-gathering-displaying-stuff.
The Big Picture
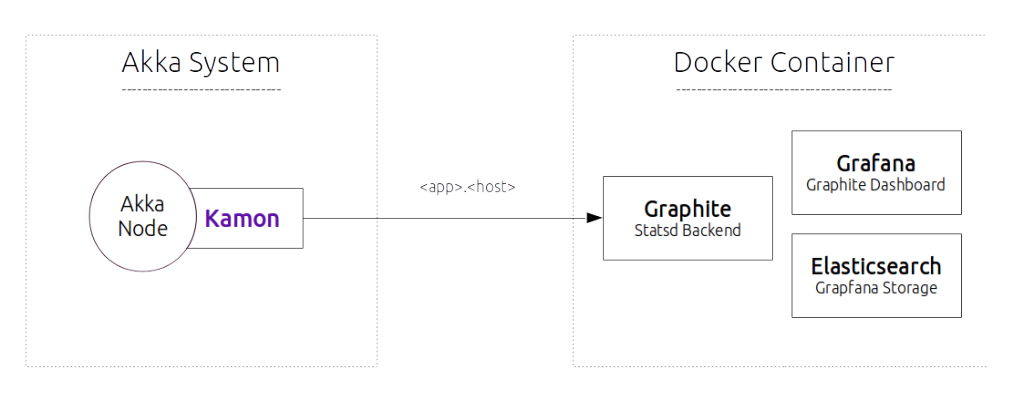
First of all, when we are done we will have this infrastructure running
Thanks to docker we don’t have to configure anything on the right hand-side to get started.
Kamon
Starting on the left of the picture. Kamon is a library which uses AspectJ to hook into methods calls
made by the ActorSystem and record events of different types. The Kamon docs have some big gaps,
but you can get a feeling of what is possible. I will not make any special configuration and just use the
defaults to get started as fast as possible.
StatsD – Graphite
A network daemon that runs on the Node.js platform and listens for statistics, like counters and timers, sent over UDP and sends aggregates to one or more pluggable backend services.
Kamon provides also other backends (datadog, newrelic) to report to. For this tutorial we stick with the free
StatsD server and Graphite as Backend Service.
Grafana
Grafana is a frontend for displaying your stats logged to Graphite. You have a nice Demo you can play
around with. However I will give a detailed instruction on how to add your metrics in our Grafana dashboard.
Getting started
First we need an application we can monitor. I’m using my akka-kamon-activator. Checkout the code:
git clone git@github.com:muuki88/activator-akka-kamon.git |
The application contains two message generators: one for peaks and one for constant load. Two types of
actors handle these messages. One creates random numbers and the child actors calculate the prime factors.
Kamon Dependencies and sbt-aspectj
First we add the kamon dependencies via
val kamonVersion = "0.3.4" libraryDependencies ++= Seq( "com.typesafe.akka" %% "akka-actor" % "2.3.5", "io.kamon" %% "kamon-core" % kamonVersion, "io.kamon" %% "kamon-statsd" % kamonVersion, "io.kamon" %% "kamon-log-reporter" % kamonVersion, "io.kamon" %% "kamon-system-metrics" % kamonVersion, "org.aspectj" % "aspectjweaver" % "1.8.1" ) |
Next we configure the sbt-aspectj-plugin to weave our code at compile time.
First add the plugin to your plugins.sbt
addSbtPlugin("com.typesafe.sbt" % "sbt-aspectj" % "0.9.4") |
And now we configure it
aspectjSettings javaOptions <++= AspectjKeys.weaverOptions in Aspectj // when you call "sbt run" aspectj weaving kicks in fork in run := true |
Last step is to configure what should be recorded. Open up your application.conf where your akka configuration resides. Kamon uses the kamon configuration key.
kamon {

  # What should be recorder
  metrics {
    filters = [
      {
        # actors we should be monitored
        actor {
          includes = [ "user/*", "user/worker-*" ] # a list of what should be included
          excludes = [ "system/*" ]                # a list of what should be excluded
        }
      },

      # not sure about this yet. Looks important
      {
        trace {
          includes = [ "*" ]
          excludes = []
        }
      }
    ]
  }

  # ~~~~~~ StatsD configuration ~~~~~~~~~~~~~~~~~~~~~~~~

  statsd {
    # Hostname and port in which your StatsD is running. Remember that StatsD packets are sent using UDP and
    # setting unreachable hosts and/or not open ports wont be warned by the Kamon, your data wont go anywhere.
    hostname = "127.0.0.1"
    port = 8125

    # Interval between metrics data flushes to StatsD. It's value must be equal or greater than the
    # kamon.metrics.tick-interval setting.
    flush-interval = 1 second

    # Max packet size for UDP metrics data sent to StatsD.
    max-packet-size = 1024 bytes

    # Subscription patterns used to select which metrics will be pushed to StatsD. Note that first, metrics
    # collection for your desired entities must be activated under the kamon.metrics.filters settings.
    includes {
      actor       = [ "*" ]
      trace       = [ "*" ]
      dispatcher  = [ "*" ]
    }

    simple-metric-key-generator {
      # Application prefix for all metrics pushed to StatsD. The default namespacing scheme for metrics follows
      # this pattern:
      #    application.host.entity.entity-name.metric-name
      application = "yourapp"
    }
  }
} |
Our app is ready to run. But first, we deploy our monitoring backend.
Monitoring Backend
As we saw in the first picture, we need a lot of stuff running in order to store our log events. The libraries and components used are most likely reasonable and you (or the more Ops than Dev guy) will have to configure it. But for the moment we just fire them up all at once in a simple docker container. I don’t put them in detached mode so I see what’s going on.
docker run -v /etc/localtime:/etc/localtime:ro -p 80:80 -p 8125:8125/udp -p 8126:8126 -p 8083:8083 -p 8086:8086 -p 8084:8084 --name kamon-grafana-dashboard muuki88/grafana_graphite:latest |
My image is based on a fork from the original docker image by kamon.
Run and build the Dashboard
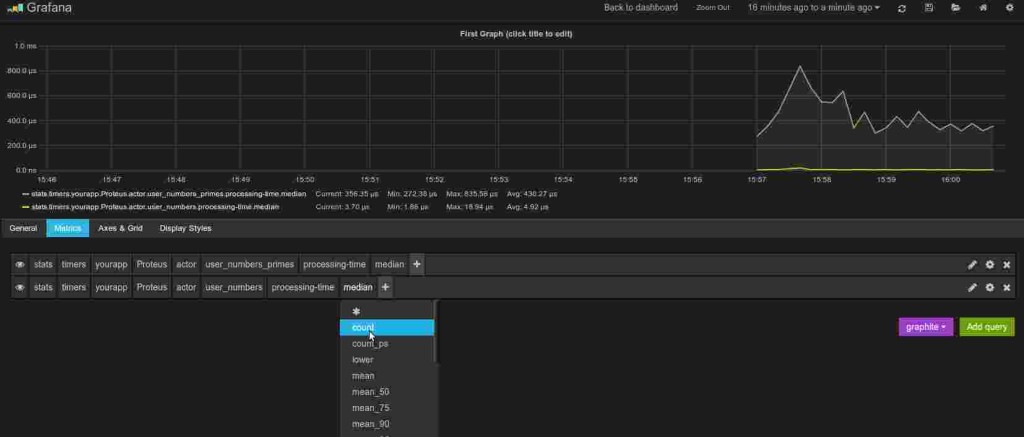
Now go to your running Grafana instance at localhost. You see a default, which we will use to display
the average time-in-mailbox. Click on the title of the graph ( First Graph (click title to edit ). Now select the metrics like this:
And that’s it!

